Showing posts with label efficient markets hypothesis. Show all posts
Wednesday, March 30, 2016
Finance's Battle of the Somme
When I think of senseless waste, I think of the Battle of the Somme. Whole generations lost in
order to move a trench line forward by a metre or two. Zoom forward in time to the modern finance industry which, for many decades, has been marshaling starry-eyed recruits in search of excess returns. I worry that all their effort has been wasted because, like the Somme's trenches, the integrity of prices can't be advanced any further once large amounts of effort are already being expended in beating the market.
Fund managers who want to beat the market must find unique information in order to get a leg up on their competitors. But the supply of such information is limited so that at some point, prices include pretty much everything there is to know about a company. Any additional effort to hunt down information is wasteful from a society-wide perspective.
The recent-ish phenomena of indexing gives us a feel for how far beyond the 'waste point' we've gone. Rather than trying to beat the market, indexers randomly throw darts at stocks in order to harvest the average market return. Throwing darts is far cheaper than hiring Harvard grads to hunt down information. An indexer is betting that information has already had most of its value wrung out of it, so any effort to search for more doesn't justify the cost.
Say that the finance industry had only progressed a step beyond the waste point. If so, then as investors begin to adopt indexing, the bits of information they stop analyzing become unique again. The marginal return to hunting for information will rise above zero and those engaged in the activity should perform better. The popularity of indexing would quickly stall as money moves back into the beat-the-market game, pushing the value of information back to down to nil. We'd expect the size of the information hunting and indexing ecosystems to stay steady over time as shifts in the marginal value of information are quickly ironed out by movement from one group to the other.
The numbers show the opposite. Index investing has been growing for three decades and shows no sign of slowing. Managed funds have been shrinking since the mid-2000s. And rather than benefiting from the unparsed information that these indexers have left on the table, fund managers continue to lag the average market return. This suggests that we went FAR beyond the 'waste point.' After all, if the brain power that indexing is releasing from the information hunting process has not made information hunting more profitable, then there was way too many people engaged in the activity to begin with.
If markets are supposed to efficiently allocate resources, why did we go so far past the waste point? I suppose we can chalk it up to a combination of greed, hubris, cynicism, and naivete. Whatever the reason, the long trek beyond the waste point has been the financial equivalent of the Somme. For decades, all those investors who thought they could beat the market would have been better off allocating their resources elsewhere. And generations of young Wall Street whizzes could have been making useful things for the rest of us rather than engaging in the equivalent of converting a scorched desert into a scorched desert.
The good news is that the rise of indexed investing is steadily undoing this misallocation. Fund managers, traders, analysts, and advisers are currently being let go so that they can move into different sectors of finance or entirely different industries, a trend that could continue given the fact that non-indexers continue to underperform the market. And this will proceed down the line to financial journalists, financial economists, and all other workers who provide support to the information hunters. These people are alert, ambitious, mobile, and intelligent so the real world should become a more productive place.
As I was writing this, I thought of this post from David Glasner.
Friday, March 7, 2014
Is the value premium a liquidity premium?
The "High minus low" strategy: Source |
If you haven't read Clifford Asness and John Liew's recent article on market efficiency, you should. There's plenty of meat in the article, but the one sinew I want to chew on is this above chart. It shows the cumulative returns to a strategy called HML, or "high-minus-low."
This strategy involves going long cheap U.S. stocks (as measured by their price-to-book ratio) and simultaneously going short expensive stocks. Over the last eighty-five years or so, cheap stocks have roundly beat out expensive ones. This is called the value premium. A large part of Asness and Liew's investing effort revolves around exploiting this premium for their clients at AQR Capital Management.
Now as the authors point out, this outperformance could be due to a combination of two things. The behavioural explanation is that people are irrational, subject to various psychological tics that drive aberrations in prices. Perhaps investors are fickle and would rather plunge into sexy and expensive concept stocks than purchase boring but cheap stocks. Asness and Liew propose the idea that investment committees don't have sufficiently long windows for evaluating the performance of their investments. Whatever the explanation, by trading against the various behavioural tics, investors can earn superior profits.
The other explanation is that the value premium has a very rational underpinning. Those who buy cheap stocks and sell expensive ones need to earn a higher return because they must be compensated for bearing some sort of inconvenience, or because they are providing the market with some extra service.
What is that something? My guess is that if you were to adjust the HML strategy's results to account for the superior liquidity return provided by stocks that seem expensive, you'd probably see the returns on cheap and expensive stocks converge. What appears to be an anomaly on the chart is just the shadow of a liquidity premium. Asness and Liew aren't exploiting an irregularity, they're producing liquidity—and getting paid a fair rate for doing so.
Take two companies that are identical except that the shares of the first are more liquid than the second (yep, I've been down this road before). Given a choice of buying either of the two, investors will always prefer the more liquid share. Owning a stock with low bid-ask spreads and plenty of depth provides investors with the comfort of knowing that should some unpredictable event arise, they can easily sell their shares in order to mobilize the necessary resources to cope with the event.
We can think of people "consuming" the comfort provided by liquid shares, much like they consume the peace of mind provided by a fire extinguisher stored away in a closet. If we want more peace of mind, we need to buy a better quality fire extinguisher and/or shares with a higher degree of liquidity. If we can do with less, then we can buy a smaller fire extinguisher and/or switch into illiquid shares.
We can decompose the price of a share into two parts—the price people pay for the share's earnings, and the premium they are willing to cough up to consume the peace of mind that its liquidity provides. Since the earnings on our two shares are the same, the portion of each share's overall price that is explained by earnings will be equal. However, people will put a small premium on the consumption value of the services provided by the illiquid shares and a large premium on the superior consumption yield provided by liquid shares. The difference in premiums means that the market price of the liquid share will be higher than the illiquid one.
Because of this price discrepancy, people will typically say that the liquid share is "expensive" and the illiquid one "cheap", but these are misnomers. The liquid shares provide a stream of valuable services that the illiquid shares fail to provide, and therefore logic dictates that they must trade at a higher price. They might seem expensive relative to underlying earnings, but only if we intentionally ignore the very real flows of consumption that they provide.
By selling "expensive" stocks and buying "cheap" ones, Asness and Liew are really just selling liquidity while taking on illiquidity. In short, in exploiting the HML line they are acting as liquidity providers. Just like Kidde (a major manufacturer of fire extinguishers) provides the world with a worthy service—peace of mind—Asness and Liew are producing and selling that very same good. They are willingly holding the illiquid long positions that others would prefer not to hold, thus forgoing the peace of mind enjoyed by others. And in borrowing and selling liquid shares, they are feeding liquidity into the market that would otherwise be stranded in someone's account at a depository.
Just like Kidde should be well-compensated for its product, Asness and Liew should be appropriately rewarded for their sacrifices. As compensation, their illiquid long position will typically appreciate at a faster rate than an equivalent liquid long position. And their liquid short position will appreciate at a slower than an equivalent illiquid short position.
This difference in expected price appreciation emerges because in equilibrium, an illiquid share needs to provide the same total expected return as a liquid share. Liquid shares already provide an outsized non-pecuniary return (their ability to act as fire extinguishers). In order to counterbalance this, the illiquid share must provide an outsized pecuniary return, or a faster rate of price appreciation. I'm ignoring dividends here. (Again, see this post).
So the HML line charted above illustrates the financial compensation that flows to folks like Asness and Liew who go out of their way to fabricate financial fire extinguishers. (I don't doubt there are also behavioural reasons for it.) Or, conversely, it represents the financial return that people are willing to forgo in order to consume the services provided by liquid shares.
To some degree, Asness and Liew's HML strategy reminds me of the strategy used by Long Term Capital Management. LTCM did a lot of convergence trades in treasury markets. It shorted "on-the-run" bonds, the most recent vintage of debt issued by the government, while purchasing "off-the-run" bonds. On-the-run bonds attract more liquidity than an equivalent off-the-run bonds, and therefore trade at a premium. Thus we see different prices for what are otherwise two identical securities. After a few weeks go by, the current on-the-run bond is replaced by the next issue and suddenly loses its liquidity premium. As long as the short position in on-the-run bonds is held until the next treasury auction, it yields a guaranteed gain when offset against the long position.
Source |
I don't think that the profits that LTCM enjoyed by exploiting the on-the-run convergence trade should be thought of as arbitrage gains accruing as a result of other people's irrationality. Much like Asness & Liew and Kidde, LTCM was fabricating peace of mind for others; it held the illiquid securities others didn't want while borrowing and supplying the market with the liquid securities that others preferred. The "excess" return that LTCM enjoyed was the market's fair reward for providing this service.
The service that Asness and Liew provides also reminds me of what a bank does. A bank purchases illiquid personal IOUs issued by families and businesses while selling highly liquid deposits. The bank needn't offer much of an interest rate on deposits because deposits already provide a high liquidity yield. It requires a high interest rate on the IOUs it purchases because it must be compensated for absorbing their illiquidity. The spread the bank earns by holding illiquid assets and providing liquid assets is similar in nature to the HML spread earned by Asness and Liew, and the on-the-run/off-the-run spread earned by LTCM.
Of course LTCM eventually bit the dust. But that didn't have anything to do with the demise of the convergence trade, it had to do with leverage. When its debtors proved unwilling to roll over LTCM's funding, the fund was forced to liquidate at a loss before its positions had converged. If LTCM had been less aggressive, it could have easily held its positions until payoff. The firm might still be in the business of producing fire extinguishers for the financial community, just like Asness and Liew are doing by participating in the HML trade.
Friday, October 18, 2013
Fama vs Shiller on the 1987 stock market crash
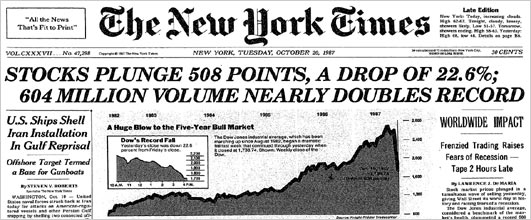
Tomorrow marks the twenty-sixth anniversary of the 1987 stock market crash. On October 19, 1987 the Dow Jones Industrial Average fell 22.6%, the largest one-day decline in stock market history. The best explanation for the decline, and the least well-known one, was put forth by economist Robert Shiller. This post gives a quick rundown of Shiller's work on understanding crash phenomena, in particular the famous 1987 event.
Eugene Fama, who along with Shiller and Lars Hansen shared the Nobel Prize this week, had very different reaction to the event than Shiller. In an essay penned not long after the crash, Fama, a true believer in the efficient market hypothesis, did his best to square the event with theory. The crash, wrote Fama,
has the look of an adjustment to a change in fundamental values. In this view, the market moved with breathtaking quickness to its new equilibrium, and its performance during this period of hyperactive trading is to be applauded. [Perspectives on October 1987, or What Did We Learn From the Crash? 1988]Fama's effort to justify the crash as a rational response to economic news falls flat. A 22.6% decline requires something cataclysmic, but no significant events preceded the crash. Sure, there was a skirmish in the Persian Gulf with an Iranian oil station, a new tax proposal in the House, and a sell signal from guru Robert Prechter, but none of these events were capable of moving markets more than a few points.
Robert Shiller, on the other hand, gathered data. The day after the crash, he sent out questionnaires to hundreds of investors. Among other questions, Shiller asked: "Which of the following best describes your theory about the decline: a theory about investor psychology, or a theory about fundamentals such as profits or interest rates?" 67.5% of individual investors and 64% of institutional investors said the crash was about market psychology. When Shiller asked what major news stories people in his survey were reacting to during the day of the crash, the most popular stories were those about past price declines themselves, not fundamental news. Noted Shiller:
It would thus be wrong to say, as many have done, that the market drop on October 19, 1987 ought to be interpreted as a statement of public opinion about some fundamental economic factor, e.g., that there is a lack of confidence in the White House or Congress. At best, any such opinions probably played a role in the crash mainly as they affected the vague intuitive assessments people under great stress made about the tendency of prices to continue or reverse, or about how other investors will react to the current situation.Put differently, the crash was a purely psychological phenomena. When it comes to explaining the 1987 stock market panic, Fama and Shiller couldn't have been further apart.
Let me take this post on a personal tangent and then I'll circle back to Shiller. I first got interested in the 1987 crash back in the late 1990s when I was a student. Fearing that equity markets were getting overextended, I started to mine 1980s price data for clues about what might happen. I discovered that the visual overlay of movements in market indexes in the late 90s was eerily similar to that of the 80s. In October 1999 I went short, sure that we were on the verge of repeating the 1987 crash. At first the markets moved a bit lower. But a week or two later prices found their footing. I didn't know it then, but the bull move that followed would be the last spurt higher before tech mania would be pricked in early 2000. Unable to stomach the losses, I covered my shorts and went back to my studies.
Though I lost money in the debacle, I did gain what I thought was an interesting idea. If enough traders like myself drew analogies to a historical crash, our combined trades -- executed on the same day -- might result in the self-realization of that crash, even though nothing had fundamentally changed about the economy. This idea jived with an observation that many market watchers had made about the 1987 crash: it was eerily similar to the 1929 crash. Wrote George Soros:
Technically, the crash of 1987 bears an uncanny resemblance to the crash of 1929. The shape and extent of the decline and even the day-to-day movements of stock prices track very closely. -The Alchemy of FinanceBoth crashes were preceded by multi-year bull markets. They each occurred on a Monday near the end of October, the first crash hitting 55 days after its bull market peak, the second 54 days. In addition to similar timing, the breadth of their declines were almost the same. The 1929 crash resulted in a 23% fall over two days, the 1987 in a 22.6% fall. I append a chart below:
Could it be that the 1987 crash occurred because traders were using the same backward-looking strategy I had when I went short in 1999? The process might have worked something like this, I reasoned: the peaks and troughs in 1987 began to randomly align with those in 1929. Backward-looking traders began to notice this alignment. A feedback loop may have emerged in which scattered fears of a recurrence of 1929 resulted in trades that pushed prices down, in turn rendering the analogy between the two periods ever more clear. A final trigger, say an anniversary date, might have been sufficient to complete the loop, resulting in a realization of the 1929 crash in 1987.
Reading through accounts of the 1987 crash, I found ample evidence of traders basing their strategies on 1929 analog models. In a famous but hard-to-come-by documentary filmed prior to the crash, 1980s wunderkind Paul Tudor Jones explained how he was using a 1929 analog model developed by his research director Peter Borish to put on a large short position in October 1987. The documentary is here, for now at least.* The Friday before the crash, hedge fund giant George Soros received a copy of Tudor Jones's study and showed it to Stanley Druckenmiller, manager of Soros's famous Quantum Fund.** On the morning of the crash, the Wall Street Journal published a chart of stock price in 1987 superimposed on stock prices leading up to the crash of 1929. News of the analog was spreading across Wall Street, and by Monday, October 19, enough momentum may have built for the analog to self-realize itself.
Paul Tudor Jones circa 1987 |
The 1929-87 event taught me that investor's minds don't react passively to underlying fundamental phenomena. Investors create stories that, when acted upon by enough people, actually shape the fundamentals. In 1987, a psychological "worm-hole" linked to an event fifty-eight years prior seems to have emerged, leading to the greatest one-day drop in market history. It was a mistake, a mental glitch, or a wrinkle in time.
Back to Shiller. I later found out that all of this had been anticipated by Shiller long before I was even old enough to buy and sell stock. In his post-1987 survey, Shiller found that 35% of individual investors and 53.2% of institutional investors reported talking of events of 1929 on the few days before October 19, 1987. Memories of 1929 were therefore "integral" in creating the 1987 crash, wrote Shiller:
Investors had expectations before the 1987 crash that something like a 1929 crash was a possibility, and comparisons with 1929 were an integral part of the phenomenon. It would be wrong to think that the crash could be understood without reference to the expectations engendered by this historical comparison. In a sense many people were playing out an event again that they knew well.Nor was this the end to Shiller's work on crashes. The memory-of-crashes effect would reappear two years later. On Friday, October 13, 1989, a mini-crash occurred, the Dow falling 6.9%. Once again Shiller sent out a questionnaire. The most likely reason for the mini-crash, wrote Shiller, was the fact that the coming Monday was to have been the second anniversary of the 1987 crash.*** The mental image of the two biggest crashes in history possibly happening that Monday would have been sufficient to amplify any random price decline into an all-out panic. Wrote Shiller:
It may be a silly notion, but silly thoughts may have come to the minds of people trying to decide whether to sell as prices plummeted in the last hour of trading. They did not then have all of the reassuring commentary that came later, and they had to act then or risk having to sell on the following Monday. - Fear of the Crash Caused the Crash, NYT, 1989
In sum, Shiller long ago provided the world with what is probably the best explanation for why the 1987 crash happened when it did, and why it fell so far. Because Fama was so closely wedded to the EMH, his only option was to stay mute on the causes. "What caused this shift in expectations? I do not know" he wrote. Fama gives us a good-enough framework for understanding 99% of market moves. But for the remaining 1%, we really do need Shiller.
* The documentary has an interesting history. See Ritholtz, the WSJ, and Business Insider, among others. Apparently Tudor Jones threatens to sue anyone who puts it up, so getting ones hands on it is challenging. While the documentary is the best place to learn about the 1929 analog model, it also appears in the first edition of Jack Schwager's Market Wizards. But do try to watch the video, it's quite fascinating in its own right.
** Said Druckenmiller: "That Friday after the close, I happened to speak to Soros. He said that he had a study done by Paul Tudor Jones that he wanted to show me. I went over to his office, and he pulled out this analysis that Paul had done about a month or two earlier. The study demonstrated the historical tendency for the stock market to accelerate on the downside whenever an upward-sloping parabolic curve had been broken – as had recently occurred. The analysis also illustrated the extremely close correlation in the price action between the 1987 stock market and the 1929 stock market, with the implicit conclusion that we were now at the brink of a collapse. I was sick to my stomach when I went home that evening. I realized that I had blown it and that the market was about to crash." - Market Wizards, Jack Schwager (1988)
*** The 1929-87 analog revisited markets once again in 1997. On Monday, October 29, 1997, the Dow went into a freefall, eventually tumbling 7% . See my explanation of the 1987-1997 analog here.
PS: If market's plunge this coming Monday, you know why. ;)
Saturday, February 9, 2013
Technical analysts beat Fama to the EMH
The following quote is a great expression of the efficient market hypothesis:
...the bulk of the statistics which the fundamentalists study are past history, already out of date and sterile, because the market is not interested in the past or even in the present! It is constantly looking ahead, attempting to discount future developments, weighing and balancing all the estimates and guesses of hundreds of investors who look into the future from different points of view and through glasses of many different hues. In brief, the going price, as established by the market itself, comprehends all the fundamental information which the statistical analyst can hope to learn (plus some that is perhaps secret from him, known only to a few insiders) and much else besides of equal or even greater importance.So who wrote these words? Fama, Malkiel, or Samuelson? Funny enough, I've pulled this quote from The Technical Analysis of Stock Trends by Robert Edwards and John Magee, the so-called bible of technical analysis. Published in 1948, it predates Fama by at least fifteen years.
In case you need reminding, technical analysts are interested in the historical record of asset prices. The traditional stereotype is that they work in musty offices filled with stock charts, the windows nailed shut so that no data from the outside world can pollute their analysis of odd-sounding chart formations. Now this view is a bit narrow. Cullen Roche points out that technical analysis comprises far more than just charting-gazing. It involves using past market data—volume, price, sentiment, etc—to divine the market's future direction. Old school chartists still exist, but so do algorithms that analyze reams of stale data in order to spit out the next period's price.
Before I explore the seeming paradox of Edwards and Magee subscribing to the EMH, here's a refresher on the various "forms," or levels, that efficient markets take. Each level refers to the type of data that is baked into efficient prices.
1. Weak form efficiency: All information contained in the record of past prices is already reflected in a stock's price. The implication is that technical analysis is worthless.
2. Semi-strong form efficiency: All information contained in past prices and all published information about a company are already reflected in the stock price. The implication is that both technical and fundamental analysis are worthless.
3. Strong form efficiency: Prices reflect all information contained in past prices, all publicly available information, and all insider information. No one can make a profit.
Now in the above quote, you'll notice that Edwards & Magee invoke aspects of both semi-strong and strong form efficiency by pointing out that market prices already contain all fundamental information and even a quantity of insider information. Of course, the two never believed in pure strong-form efficiency since they thought that abnormal profits could be made by anyone who followed their technical methodology. If anything, what Edwards & Magee are describing is a fourth level of market efficiency which, for lack of imagination, I'll call "semi-weak" efficiency:
4. Semi-weak form efficiency: Prices reflect all published fundamental and insider information, but not information from past prices. The implication is that no one can make earn profits from using fundamental data and only technical analysis is worthwhile.
Why do academic finance books list semi-strong efficiency but not semi-weak efficiency? Why open the "efficiency door" to fundamental analysts but not technical analysts? In general, I find that academics tend to display a strong aversion to technical analysts, compounding an already-existing sense of persecution felt by technical analysts when it comes to the rest of the investment community. Most discourse in the investment community is of a fundamental nature, and technical analysts are viewed as a bit weird. I remember observing this sense of frustration at a society of technical analysts meeting a decade ago. The running gag that day among the angst-filled technical analysts was to refer to fundamental analysts as fundamental ANALysts.
So what explains the bone that academics have to pick with technical analysis and semi-weak efficiency? My guess is that it starts with the random walk theory. The random-walk theory is important to academic finance because it implies the existence of a normally-distributed data set. It's relatively easy to run statistics with this kind of data. But if markets are semi-weak this implies that successive price changes are not independent of each other, or, in technical analysis lingo, that trends are meaningful. If changes are dependent on prior changes, the normal distribution can't be used. This means that finance theory is a lot more difficult than before.
On the other hand, if markets are
Subscribe to:
Posts (Atom)